The Birth and Death of Russell Lake
Remember the excitement surrounding the damming of Russell Fjord by the Hubbard Glacier last year? The rising water, the marine mammal rescue effort, and finally, the spectacular outbreak in October? While all of this was occurring and Russell Fjord was receiving national and international media coverage, two small instrument packages, deployed by the University of Alaska's Institute of Marine Sciences, sat quietly on the bottom of Russell Fjord, recording pressure, temperature and salinity at half-hour intervals. These submerged sentinels provided a striking record of the filling and outbreak of "Russell Lake".
When we heard of the damming, our first priority was to start recording the water level rise as quickly as possible. The damming allowed us to treat Russell Fjord as a giant natural bucket. Our plan was to use measurements of water level rise over time to obtain a runoff record from a region that had no stream gauges. We had estimated how high the water level would rise in Russell Fjord during a near-closure in 1973, and we wanted to check our crude estimate of 31 meters per year.
We measured the water level rise by measuring changes in pressure (which is due to the weight of the column of water above the pressure gauge). We had standard oceanographic current meters, so we modified them by removing the direction vanes and rotors used for current measurements and equipping each with a more sensitive pressure sensor. These current meters consist of a battery-operated programmable recorder contained in a water-tight pressure case, and served our purpose perfectly. The meters were deployed in a bay at the southern end of Russell Fjord and their locations were marked with small surface floats. It was necessary to add extra line to the floats several times during the summer as the water level rose. We replaced the data tapes and batteries during field work in September, and removed the instruments in January, when ice surrounded the floats and threatened to carry the instruments to deeper water. The only drawback to this approach was having to wait until the instruments were recovered to obtain the data. Daily hand level measurements of the water level were undertaken by the U.S. Forest Service and the U.S. Geological Survey.
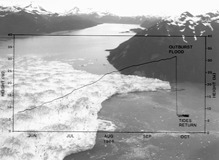
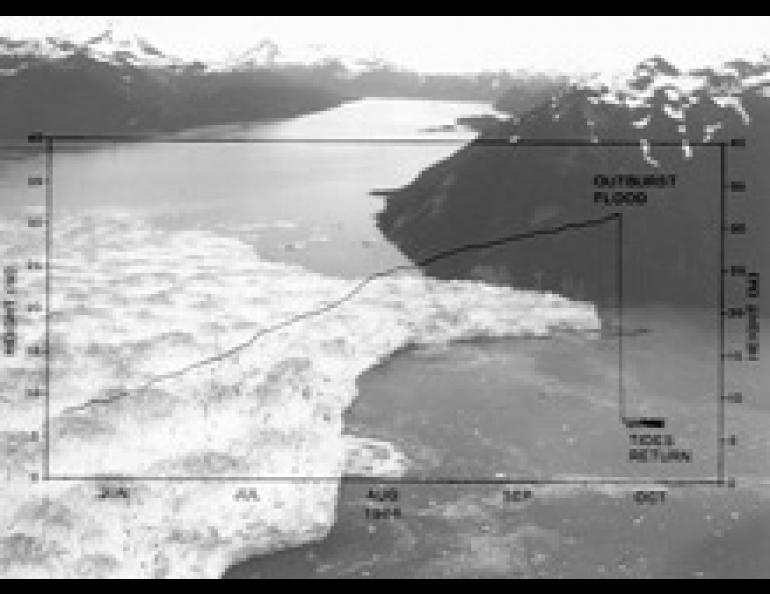
The figure shows the record of one IMS pressure recorder from June 4 to mid October, 1986, and documents the time course of the water level rise, the outbreak, and finally, the return of tides as the water of the fjord resumed communication with Yakutat Bay following the outbreak. The water level in the fjord rose 24 m over the summer; maximum rise rates were 60 cm per day. We calculate that some 5 cubic kilometers (1 cubic mile) of water accumulated during the summer and drained from the fjord in 24 hours when the glacier dam failed.
What does the future hold? There is little doubt that the Hubbard Glacier will advance again and dam Russell Fjord, but the big question is "when?" A telemetering water level gauge installed by the U.S. Geological Survey in September, 1986, will record and immediately report the water level, so the self-contained instruments we used in 1986 will be unnecessary.
A remarkable amount of information was gathered on short notice last summer during the interdisciplinary research effort coordinated by the U.S. Forest Service and the U.S. Park Service. Scientists are keeping a close eye on Russell Fjord and are ready to spring into action again when Mother Nature performs another "experiment".