Computed Earthquake Magnitudes Depend on Instrumentation
When Charles Richter devised his now-famous magnitude scale for earthquakes, he chose the word "magnitude" in analogy with its usage in astronomy where it is used to relate the brightness of stars (never mind that the brighter the star, the smaller its magnitude). This analogy is a good one to use in trying to understand the difference among the various magnitude scales used by seismologists. The magnitude that is assigned to an earthquake depends in some cases upon the instrument which is used to "look" at the quake; just as the brightness of a star depends upon the kind of glasses we may be wearing.
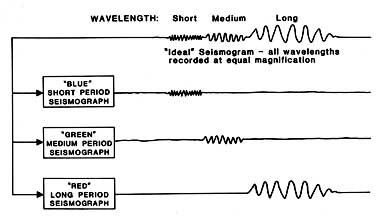
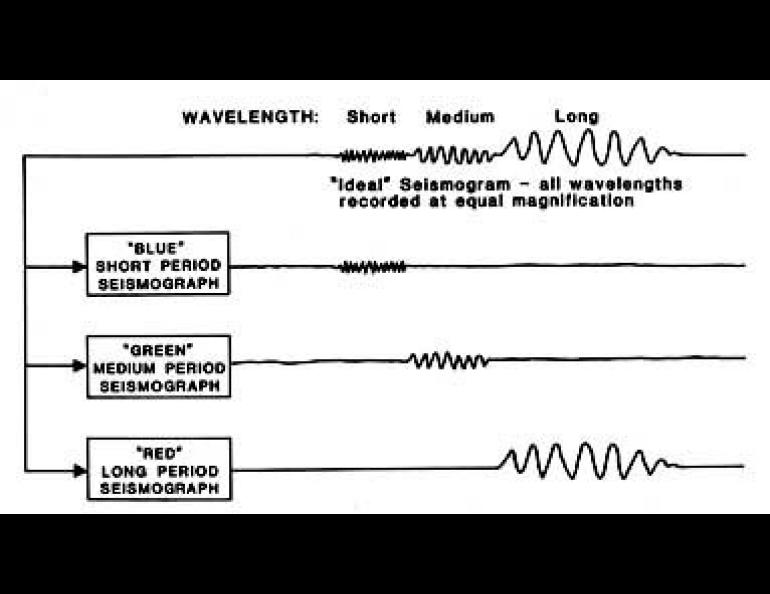
Suppose that a certain star radiated twice as much red light as blue and you were wearing glasses that transmitted red light best, while your friend was wearing ones that better transmitted blue light. You would say the star was twice as bright as your friend would. Similarly for earthquakes and seismographs (the seismologists's glasses), some earthquakes radiate relatively more energy at long wavelengths than others, and some seismographs are more sensitive to long earthquake waves than to short ones.
Good examples are two great earthquakes which occurred near Prince William Sound, Alaska. The Good Friday Earthquake of March 27, 1964, the largest North American earthquake ever recorded, is commonly reported to have a magnitude in the range 8.4 to 8.6 and yet the Yakutat Bay earthquake of September 10, 1899 is listed as a magnitude 8.6... how can this be? The answer is that both of these quakes have been assigned incorrect magnitudes. Not because the seismologists goofed, but simply because of the "glasses" they had available with which to look at the size of these earthquakes.
The seismographs used in 1899 to record the Yakutak Bay earthquake have recently been recalibrated against modern instruments. The result is that this turn-of-the-century event is now listed as having a magnitude of 8.0. For the Good Friday earthquake, recent research has shown that the very largest earthquakes radiate a great deal of energy in waves that are much longer than the routine seismographs of 1964 could record. When the energy carried at these long wavelengths is accounted for, the magnitude of the Good Friday earthquake is computed at 9.2. Thus, rather than being roughly equal in size to the 1899 event, the Good Friday earthquake actually radiated more than 60 times as much total energy.
Image Caption Cont: One can easily see that in this case a magnitude calculated from the seismogram of the "RED" seismograph would be larger than that from either the "GREEN" or the "BLUE" seismograph. The Good Friday Earthquake on March, 1964 produced a great deal of long-wavelength energy and since we did not have seismographs of the "RED" type in routine operation then, the magnitude of the earthquake was underestimated.