
Multicolored spirals a different way of envisioning space weather data
Mark Conde, professor of space physics at the University of Alaska Fairbanks Geophysical Institute, wanted something easier to use for the analysis of solar activity data. And something easier on his eyes would also be good.
So he created multicolored data spirals. Strip away their data labels, and the spirals could hang as wall art.
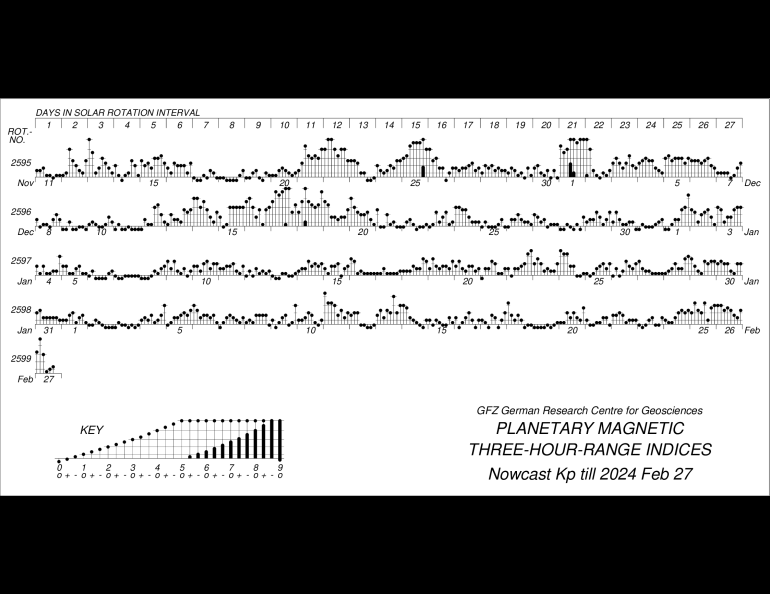
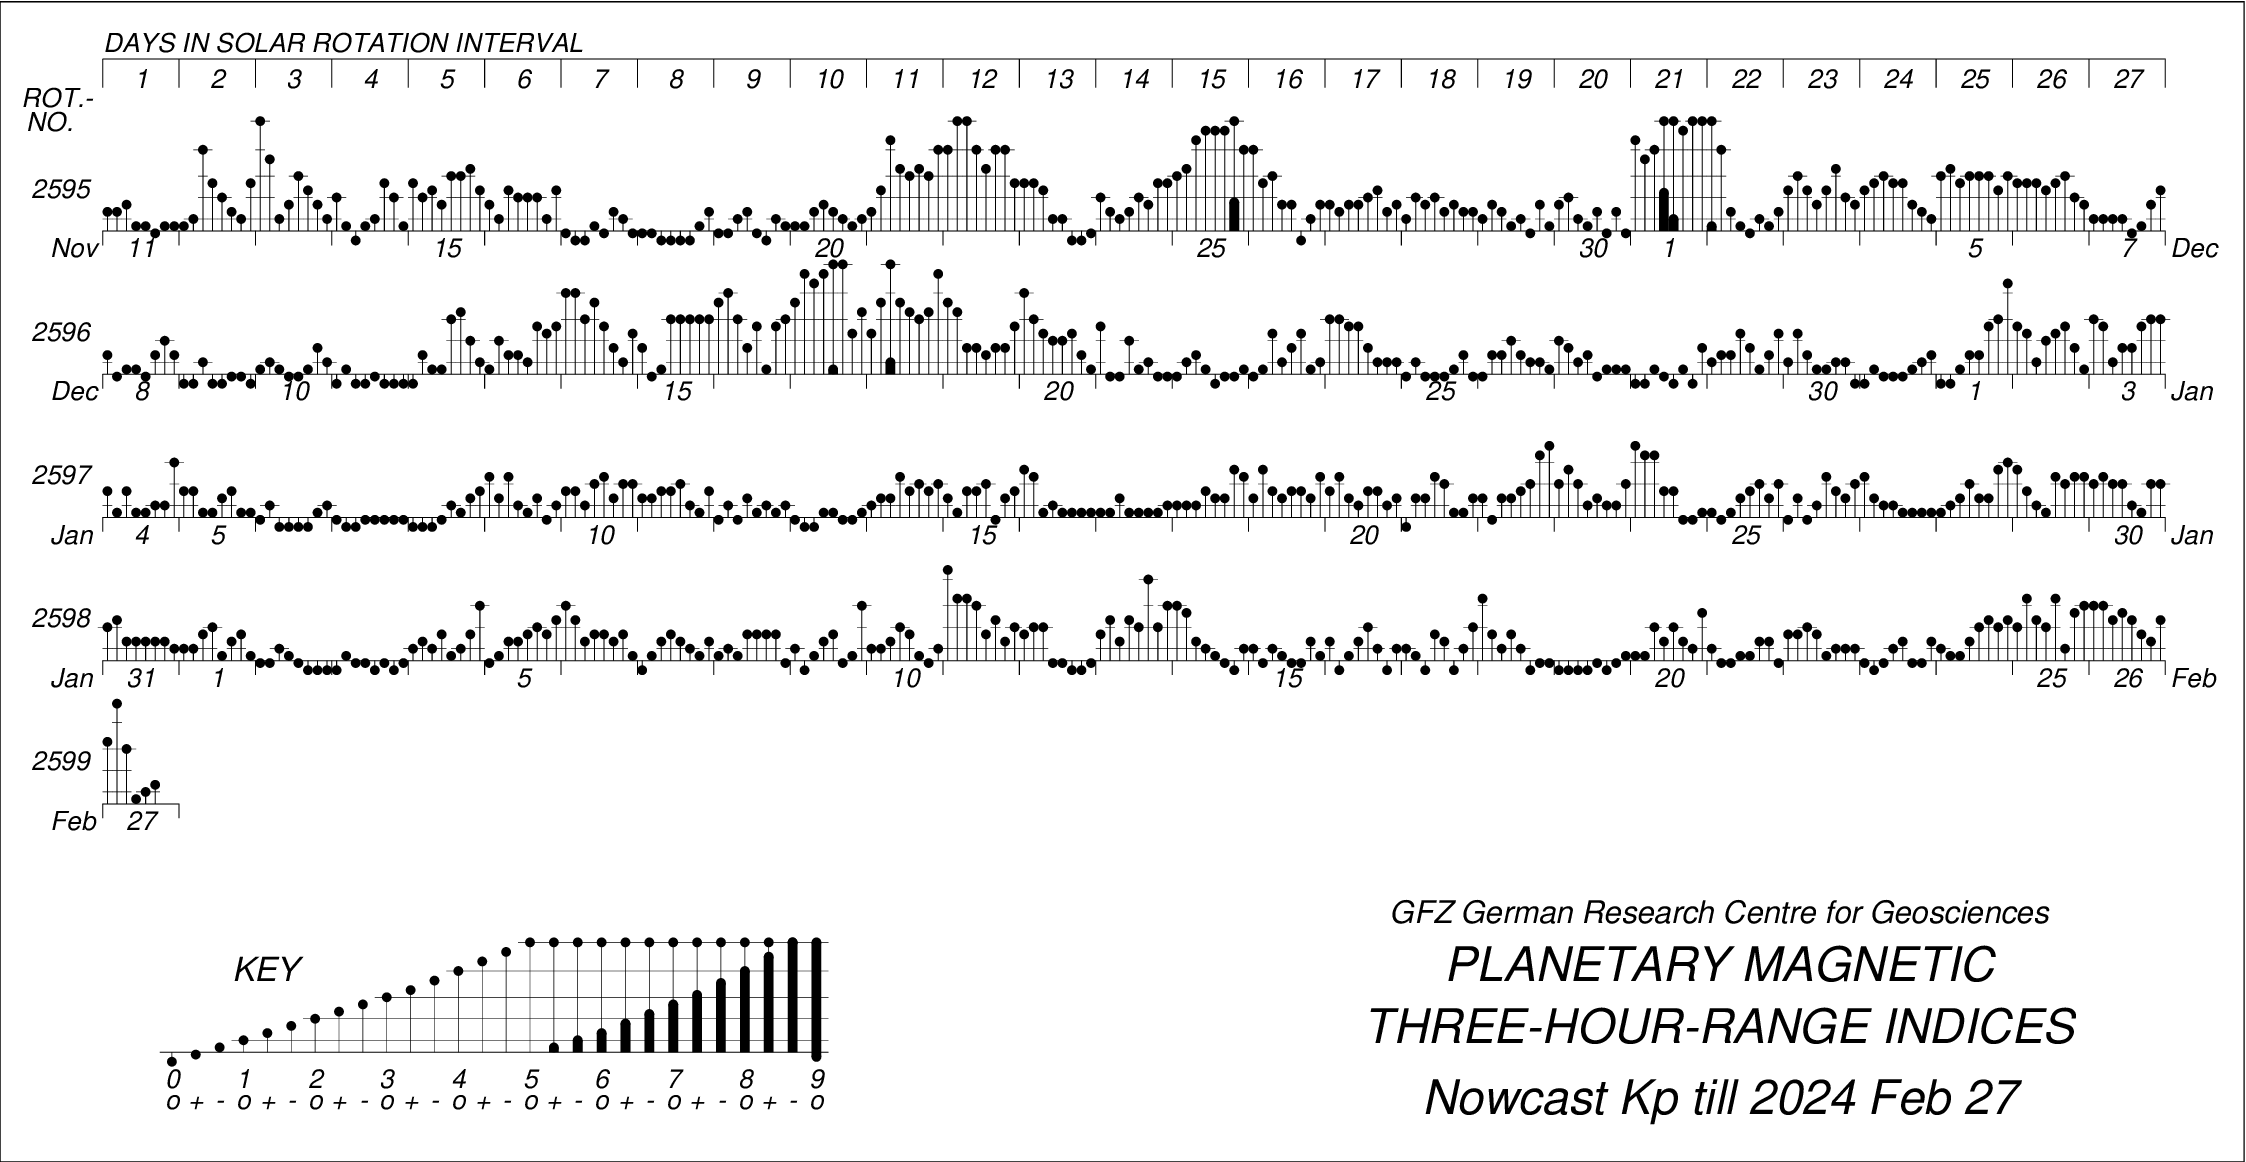
“The reason I decided to try plotting the space weather data in a spiral form is that the widely-used alternative format — the so-called "Bartels musical diagram" — stacks the solar rotations vertically, with discontinuities when the (arbitrarily defined) rotations begin and end,” Conde said.
Take a look at a Bartels diagram. You’ll think for a moment you are looking at a musical score and easily understand why scientists refer to it as the "Bartels musical diagram.”
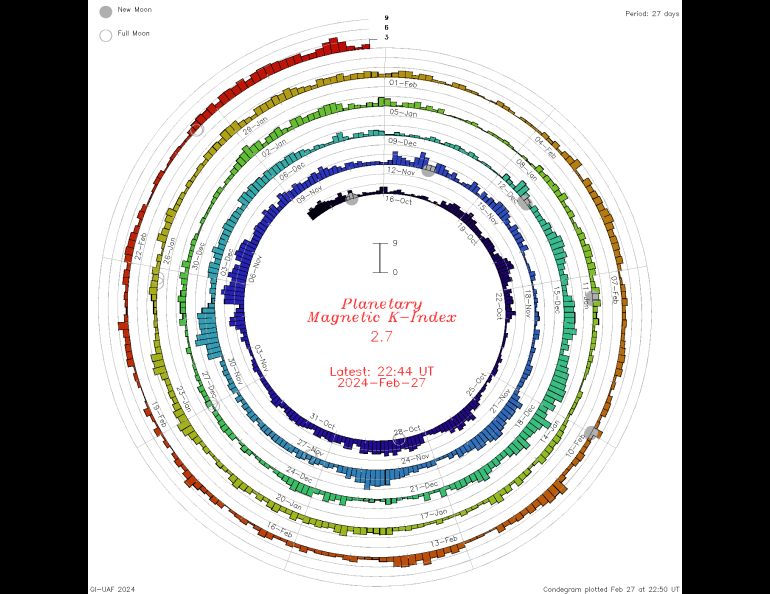
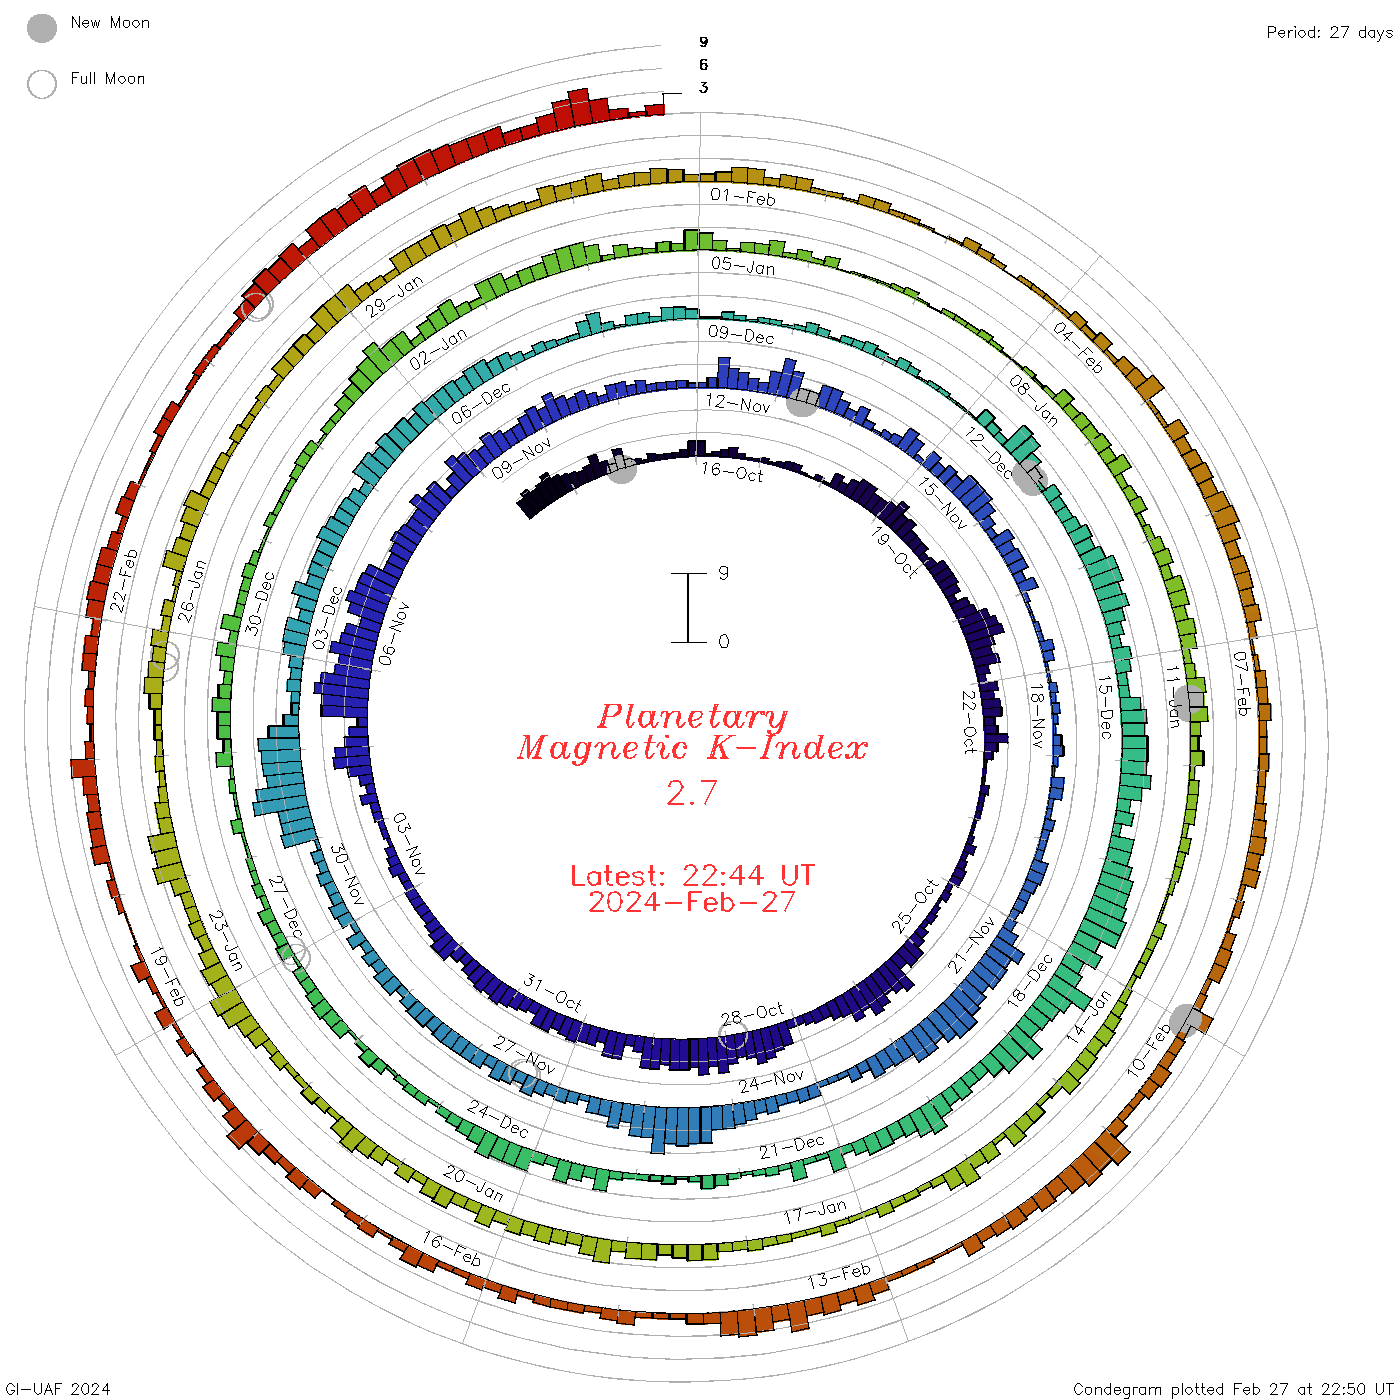
Above are examples of a Bartels diagram and one of Conde’s diagrams. These “Condegrams” are easy to use and easy on the eyes.
“When I first started making these plots — in the late 1990s, as I recall — I was quite surprised that nobody appeared to have done it before,” he said. “It seemed to me to be the most obvious way to plot solar/space weather parameters.”
The Condegrams show nine types of solar-related data. The underlying data updates every minute, and the spirals are updated every 10 minutes.
Conde said he wanted a plot that didn't impose arbitrary boundaries between solar rotations.
“I also felt that the approximately circular form of the spiral naturally invokes the concept of the sun rotating,” he said. “And I could imagine these plots being made with a pen-recorder drawing onto a circular piece of paper that is rotating anticlockwise once per 27 days.”
View all of Conde's current diagrams here.
Conde explains his spirals at the bottom of the website on which they appear.
“Current time should be at the top and in the horizontal center of each spiral,” the text reads. “Time runs backward from that location — age increases anti-clockwise around the spiral and inward toward the center. Up to five cycles of the spiral are shown. The cycle period is 27 days.
Conde’s website explains that disturbances produced by long-lived solar features such as coronal holes can persist for several solar rotations, meaning they will appear on the spiral plots at similar clock angles over several cycles of the spiral.
“If such features can be identified, they can be considered when making space weather forecasts over look-ahead periods longer than the few days that it takes for the solar wind to travel to Earth from the sun,” the website states.
Data come from services.swpc.noaa.gov, except for the Poker Flat Research Range magnetic delta-H component, which was provided by the University of Alaska Geophysical Institute, and the SuperDARN cross-polar-cap potential difference, which was provided by Evan Thomas at Dartmouth College.