SARVIEWS provides free hazard data quickly
University of Alaska Fairbanks scientists are presenting their work at the American Geophysical Union Fall Meeting in New Orleans this week. Here are some highlights of their research, as shared at the world’s largest Earth and space science meeting.
Hurricanes Harvey and Irma made landfall this autumn within two weeks of each other. In their wake, emergency response professionals labored to quickly understand the immediate threats and damage tolls. Adding to the difficulties, flooding and treacherous terrain makes land-based surveillance hazardous, while satellite coverage is severely limited by cloud cover.
However, synthetic aperture radar mounted on satellites was able to provide accurate and detailed maps on flood extent and landscape change.
“For the first time SAR is really making a difference,” said Franz Meyer of the University of Alaska Fairbanks Geophysical Institute. “We have been providing some of the more crucial datasets for the response to the hurricanes over the summer season. In many cases, we were the first ones to be able to map where the water is, where the damage is. It has an enormous benefit for many emergency response disciplines, and it is really the first time we can do that.”
This year, Meyer and his colleagues from the UAF Geophysical Institute and the Alaska Satellite Facility released SARVIEWS, a tool to help scientists, the public and emergency management professionals monitor natural hazards as they occur. Meyer gave a talk about the project at the 2017 American Geophysical Union Fall Meeting on Dec. 13.
SAR technology sends out pulses of radio waves to map the surface. These waves hit the surface of the Earth and reflect back to the radar device. As the instrument on the satellite moves across the Earth, the change in the time it takes for the pulses to return can be used to map the surface of the Earth. The big advantage is that these waves cut through cloud cover and do not require sunlight, unlike satellite imagery.
The hurricane information is only a small part of the project. SARVIEWS’ main function is currently to automatically monitor earthquake and volcano hazards, providing valuable data on hazards as they occur.
SARVIEW takes advantage of already existing networks of hazard alerts such as the U.S. Geological Survey Earthquake Notification Service and Volcano Notification System. Once these programs detect an event, they send emails and notifications with the location and details of the event to subscribed users. SARVIEWS is one of these users, and it is automatically triggered when it receives alerts for significant events. Once triggered, project collects SAR data on the site of the event from European Union’s Sentinel-1 satellite. Processing is then implemented using Amazon Cloud to provide geocoded and terrain-corrected time series of SAR data products over the affected area from just before the event until a few months after.
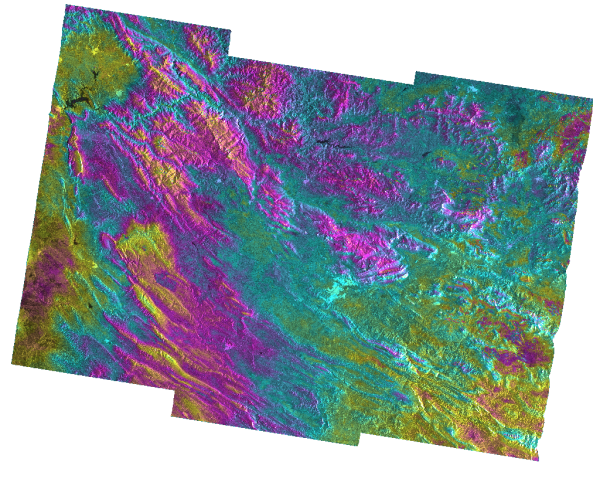
Products include images that can be used for mapping and assessment of change as well as interferograms, which contain information about surface deformation associated with events such as an earthquake or a volcanic eruption.
From the time the alert goes out, it typically takes only a few hours until the data is ready to be used. Meyers gave a recent example at his talk: When a magnitude 7.2 earthquake occurred at the Iran-Iraq border on Dec. 12 at 6:18 p.m. UTC, SARVIEWS data was available by 3 a.m. Previously, this kind of regularly observed and global SAR data was not readily available.
SAR technology requires an enormous amount of processing power and data storage — each image requires five to 10 gigabytes. Meyer estimates only few scientists know how to create usable information from the data.
“Creating this kind of information is hard,” Meyer said. “There is a lot of signal processing, there is a lot of complicated electrical engineering knowledge that goes into this data. A geologist who knows everything about earthquakes knows that these datasets are useful but doesn’t necessarily have the processing capacity to create these datasets himself. So what we do is we create these datasets and provide them to the researchers, so that they can then make sense of what happened on the ground.”
With the automated system providing usable data, the maps and images can be used by anyone from a Federal Emergency Management Agency agent trying to map a disaster to a geologist aiming to understand earthquake dynamics. The project is public, free and readily available to all.
Fritz Freudenberger, University of Alaska Fairbanks Geophysical Institute, 907-474-7185, ffreudenberger@alaska.edu


