
Scientists use forest color to gauge permafrost depth
Scientists regularly use remote sensing drones and satellites to record how climate change affects permafrost thaw rates — methods that work well in barren tundra landscapes where there’s nothing to obstruct the view.
But in boreal regions, which harbor a significant portion of the world’s permafrost, obscuring vegetation can stymy even the most advanced remote sensing technology.
In a study published in January, researchers in Germany and at the University of Alaska Fairbanks’ Geophysical Institute developed a method of using satellite imagery to measure the depth of thaw directly above permafrost in boreal ecosystems. Rather than trying to peer past vegetation, they propose a unique solution that uses variations in forest color to infer the depth of permafrost beneath.
The forest for the trees
Permafrost deposits in the northern hemisphere have been continuously frozen for hundreds of thousands of years. The soil layer directly above that of permafrost, however, is much more dynamic — freezing and thawing with the seasons and growing or shrinking as it interacts with different types of vegetation at the surface.
Because permafrost in boreal regions is often overlaid with thick forest cover, typical methods of measuring permafrost and the active layer that work well in tundra regions — like using pulsed lasers or radar that penetrate the soil — are ineffective and can give spurious results.
“The canopies get in the way in forested regions,” said Christine Waigl, a researcher in the Geophysical Institute at the University of Alaska Fairbanks and co-author on the study. “Some remote sensing instruments can penetrate the vegetation cover, but the interpretation requires specialized knowledge.”
Instead of looking past the forest cover, scientists have turned to a variety of indirect methods. One approach is to assign categories to vegetation in order to obtain broad estimates for the size of the active layer underneath. The results can be imprecise — similar to the difference between a sketch of a landscape and a high-resolution photo of it.
Instead, lead author Veronika Döpper, a researcher at the Berlin Institute of Technology, took a different approach, one in which she viewed the vegetative landscape as a continuum.
“In natural forests, the plants around you don’t just fall into one category or the other with no gradient in between,” said Döpper. “So in our study, rather than saying we had a birch-dominated forest or a black spruce-dominated forest with corresponding deep or shallow permafrost, we used our satellite imagery to see the gradient between the two.”
Remote sensing color palette
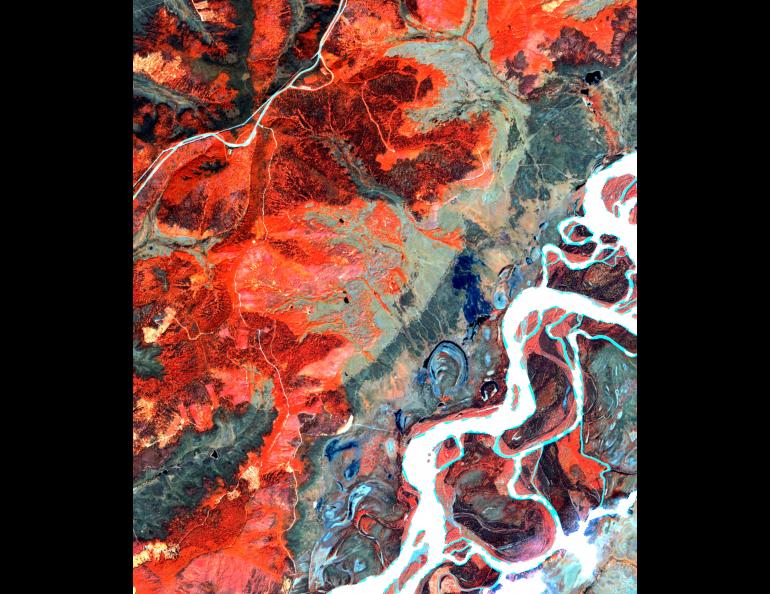
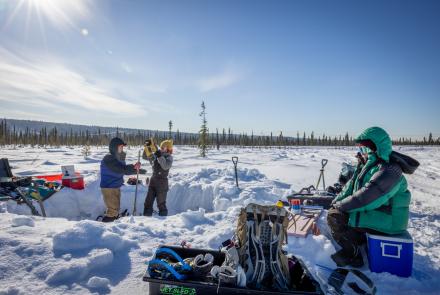
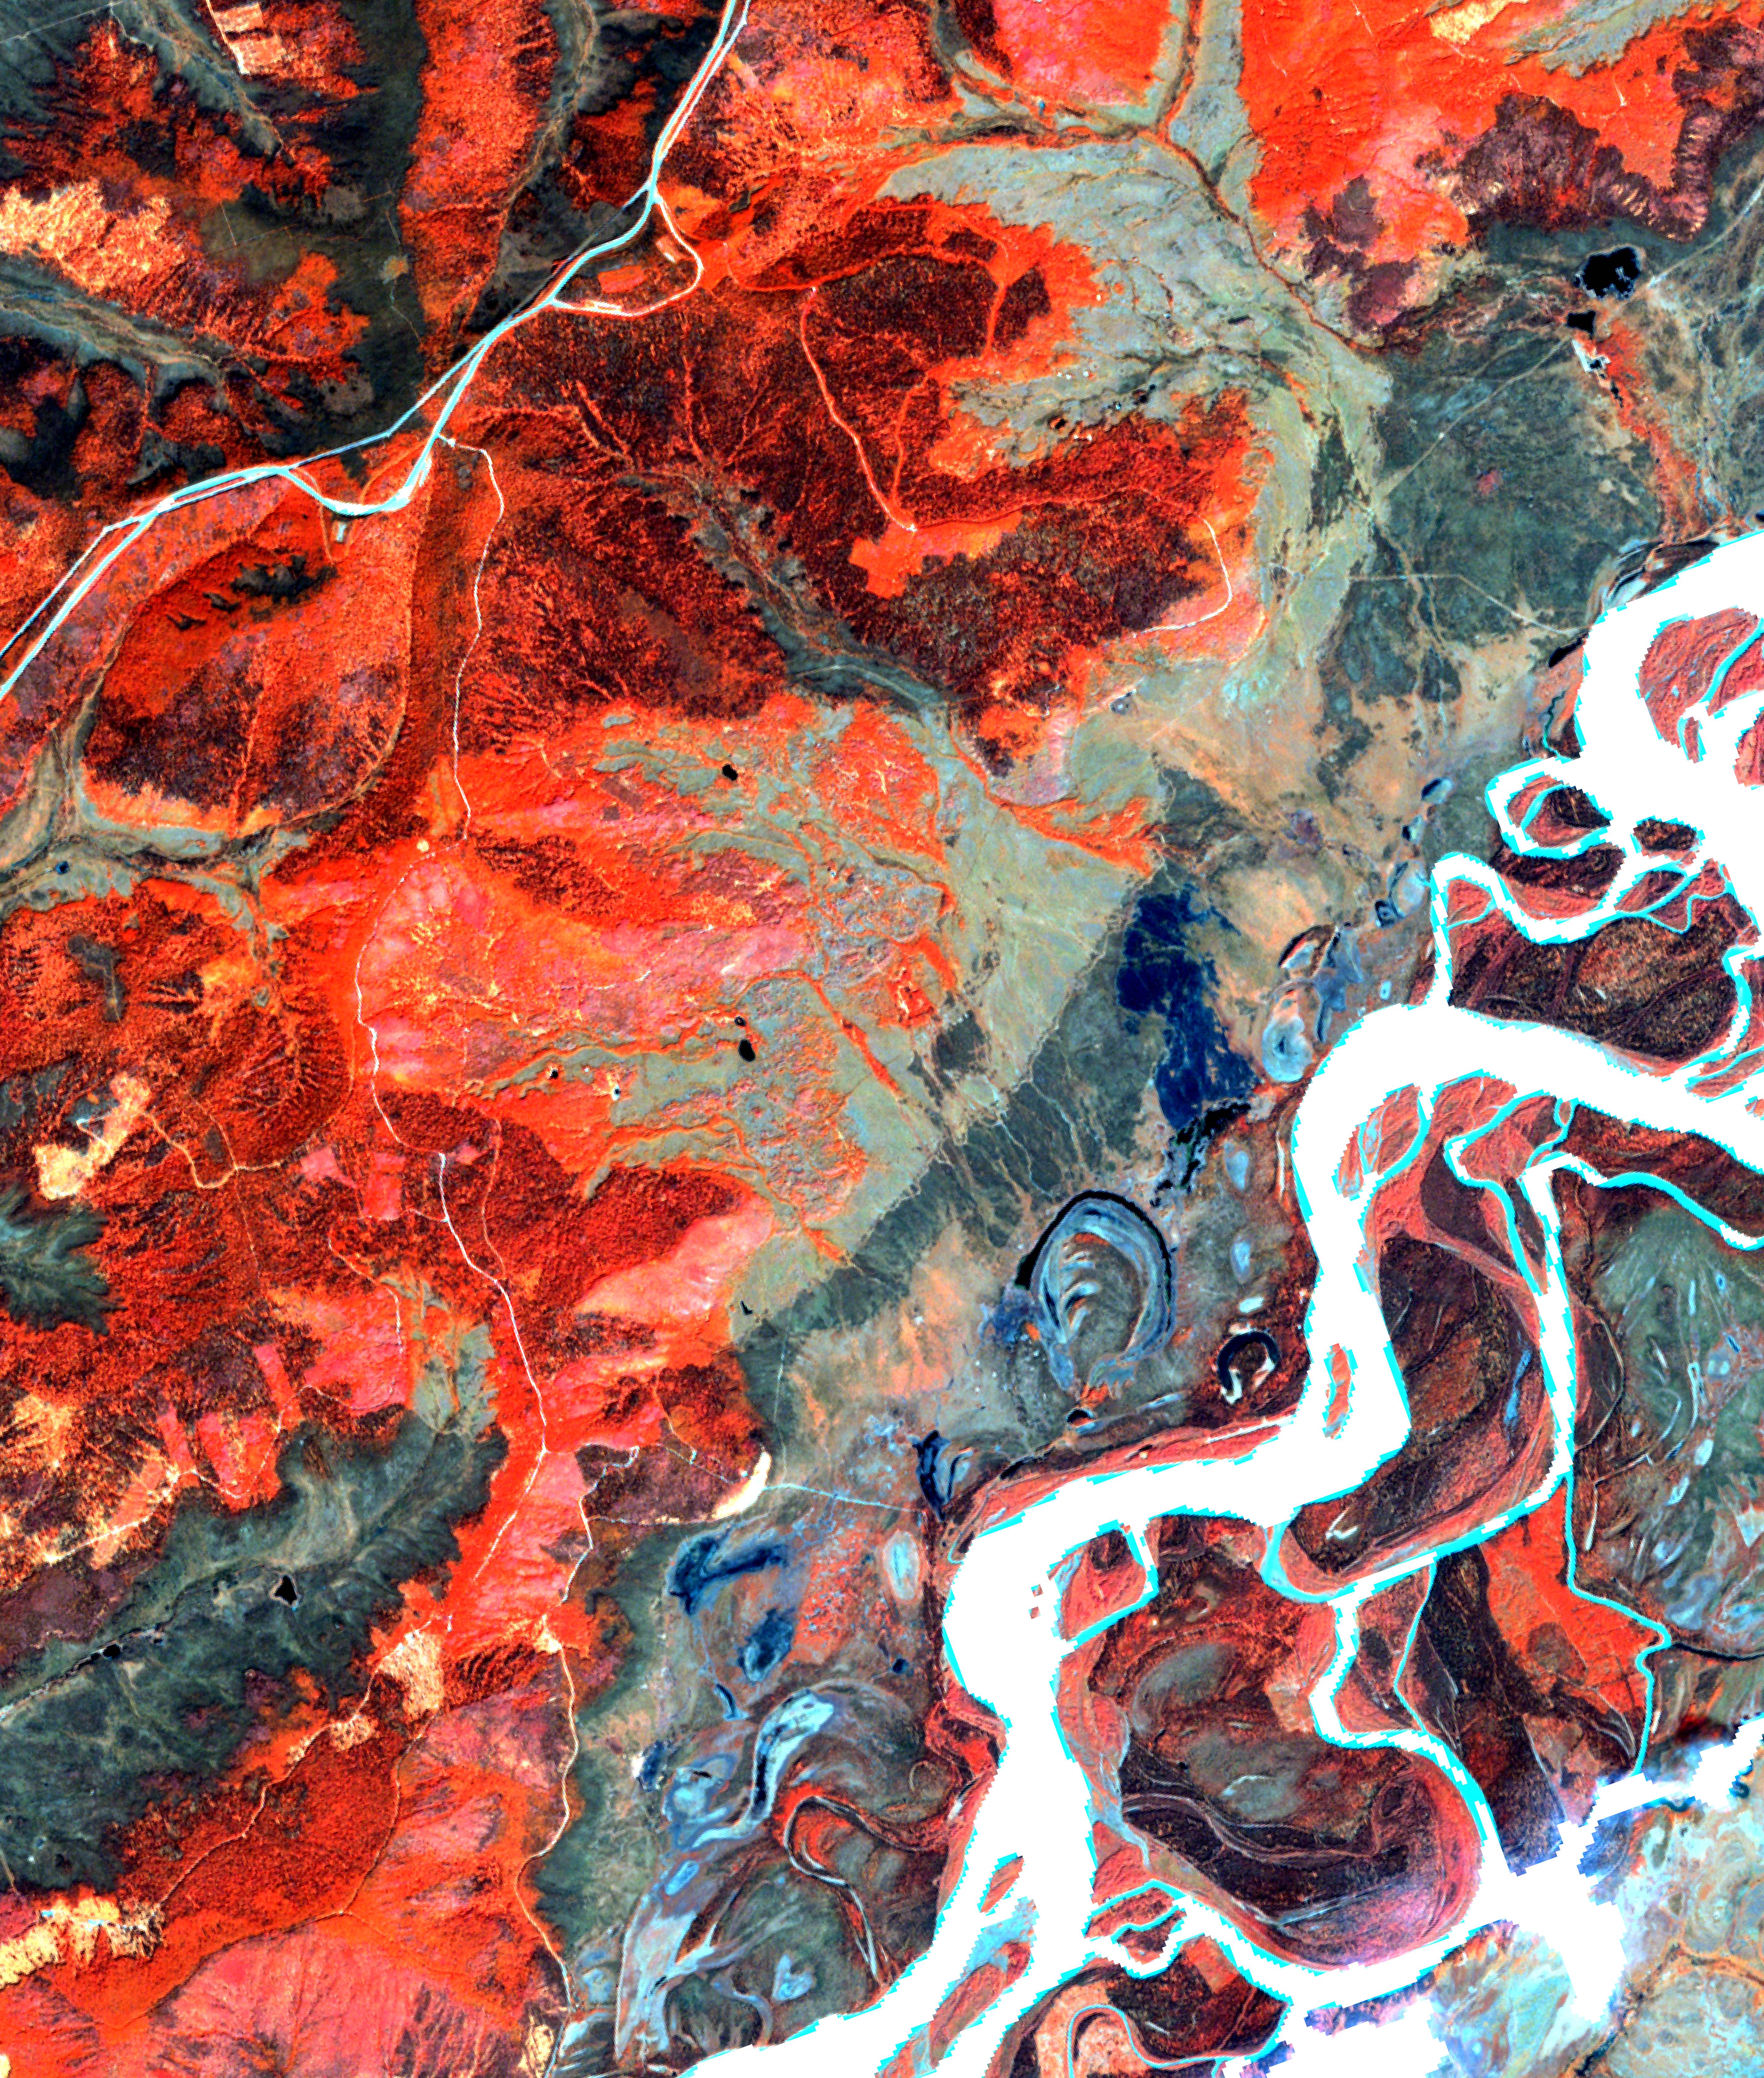
To achieve this goal, Döpper obtained satellite imagery of the forests surrounding the city of Fairbanks, Alaska, that were taken during the summer of 2018. In order to know what she was looking at, Döpper set up over 65 10-by-10 meter plots outside Fairbanks that same summer in which she identified all the trees and shrubs, directly measured the depth of the active layer and recorded the location with GPS.
By using the GPS coordinates to locate each plot on the satellite maps, Döpper could then say how the total number of species in a given plot contributed to the color of those plots as seen in her remote sensing imagery.
“Different types of vegetation will have completely different tones in their color spectra and reflectances, which we can use to map vegetation composition,” said Döpper.
With her plots as color guides, reflectances could then determine the exact type of vegetation growing over large swaths of forested and unforested areas outside of Fairbanks and, by proxy, could estimate the precise thaw depths for the same area.
Not only does this new approach promise to provide more accurate and abundant estimates of permafrost depth for use in climate modeling, it’s also a valuable tool for communities in boreal regions.
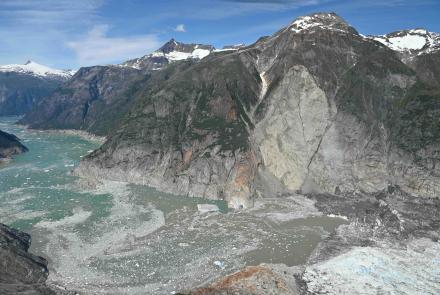
When permafrost melts, the runoff bores channels through the soil, destabilizing the topography overhead. This can result in ground subsidence and landslides, endangering lives and posing risks to infrastructure.
Over 80% of Alaska is covered in permafrost. As these deposits continue to melt, innovative methods of monitoring their disappearance will be essential in more ways than one.
Veronika Döpper, Berlin Institute of Technology, v.doepper@tu-berlin.de
Christine Waigl, University of Alaska Fairbanks Geophysical Institute, cwaigl@alaska.edu