Volcano study examines relationship between seismic signals, sound waves
A study of relationships between seismic signals and sound waves from an erupting volcano in Alaska may someday help scientists infer the height of an ash plume and the status of an eruption they can’t see.
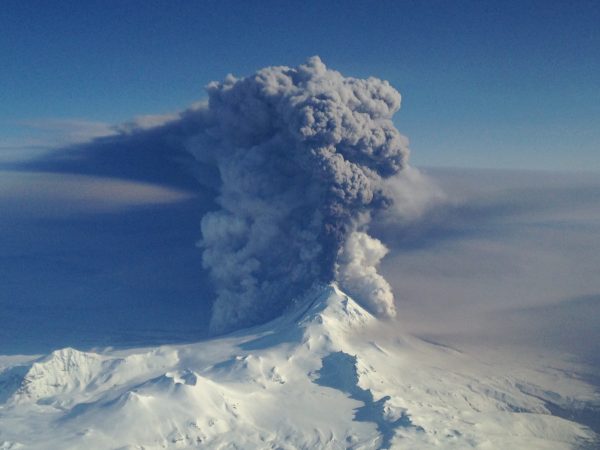
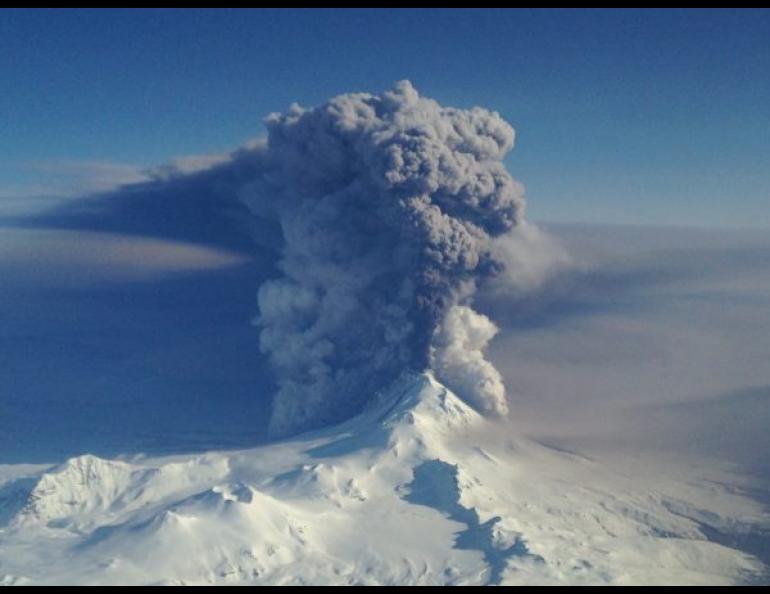
The study, published recently in the journal Science, examined multiple data sources from the well-documented March 2016 eruption of Pavlof volcano on the Alaska Peninsula.
“Volcano scientists regularly use seismic and low-frequency acoustic, or infrasound, data to monitor and study explosive volcanic eruptions. However, the precise relationship between seismic and infrasound data and the size of the eruption is still unclear,” said lead author David Fee of the Alaska Volcano Observatory at the University of Alaska Fairbanks Geophysical Institute. The study was funded by the National Science Foundation and AVO.
Fee and his colleagues analyzed data from seismic and infrasound stations spread across Alaska, including six seismic stations on the slopes of Pavlof and some of the 45 EarthScope Transportable Array stations that were recently deployed across Alaska. The scientists compared the data to satellite images and pictures of the eruption plume transmitted from a webcam about 37 miles southwest of Pavlof at the airport in Cold Bay, Alaska. The eruption began March 27 and lasted about 40 hours, resulting in a sustained ash plume that grew from 3 to 5 miles in height and extended more than 372 miles to the northeast and eventually to Canada. More than 100 commercial airline flights were canceled and minor ashfall was observed in communities downwind up to 280 miles away.
As they examined the different data sources for the course of the eruption, Fee and his colleagues noticed some surprising relationships.
“Amplitudes from the seismic and infrasound data suggested the eruption was tapering off, but the data from the webcam — a picture every 10 minutes — made it clear that there was still a significant ash plume at close to 28,000 feet, definitely in the range of commercial aircraft.”
Fee and his colleagues think this lag between seismic activity and dissipation of the ash plume happens in many other volcanic eruptions and may be common during explosive volcanic eruptions.
As they examined the data from Pavlof, they also noticed similarities to other natural phenomena.
Scientists have recently been using seismic data to estimate how much water is flowing in rivers, and they have noticed that erosion of the riverbed produced a similar change in the relationship between seismic noise and river discharge, Fee said. By comparing photos of the volcanic vent at Pavlof from before and after the eruption it was clear there had been significant erosion of the walls of the vent. The vent had widened about 430 feet during the eruption. Fee’s data suggests that what happens in a volcanic vent has similarities to what happens in an eroding riverbed.
“We think the source of the seismic and acoustic signals during this eruption is closely related to erosion of the volcanic vent,” Fee said.
Eruptions in Alaska are difficult to forecast, Fee said. Conditions are challenging and there are limited data collection sites compared to other places. At the same time, Alaska is a major pathway for aircraft, so the possibility of ash plumes is always a major concern during an eruption. Anything that can add to the accuracy of models that forecast the course of an eruption is important.
“An eruption can begin fast, and each volcano is different. It’s rare that you have the same precursory signals from eruption to eruption. We’re getting better at interpreting the signals but there’s inherent variability in the system,” Fee said. “By combining infrasound and seismic data we can extrapolate possible ash plume heights and other hazards about an eruption we can’t see. Our results should have some significant implications for future volcano monitoring and research.”
ON THE WEB: Access the study at http://science.sciencemag.org/content/355/6320/45.
NOTE TO EDITORS: Photos from the Pavlof eruption are available at https://www.avo.alaska.edu/activity/Pavlof.php.
Sue Mitchell, University of Alaska Fairbanks Geophysical Institute, 907-474-5823, sue.mitchell@alaska.edu
David Fee, University of Alaska Fairbanks Geophysical Institute, 907-474-7564, dfee1@alaska.edu


